

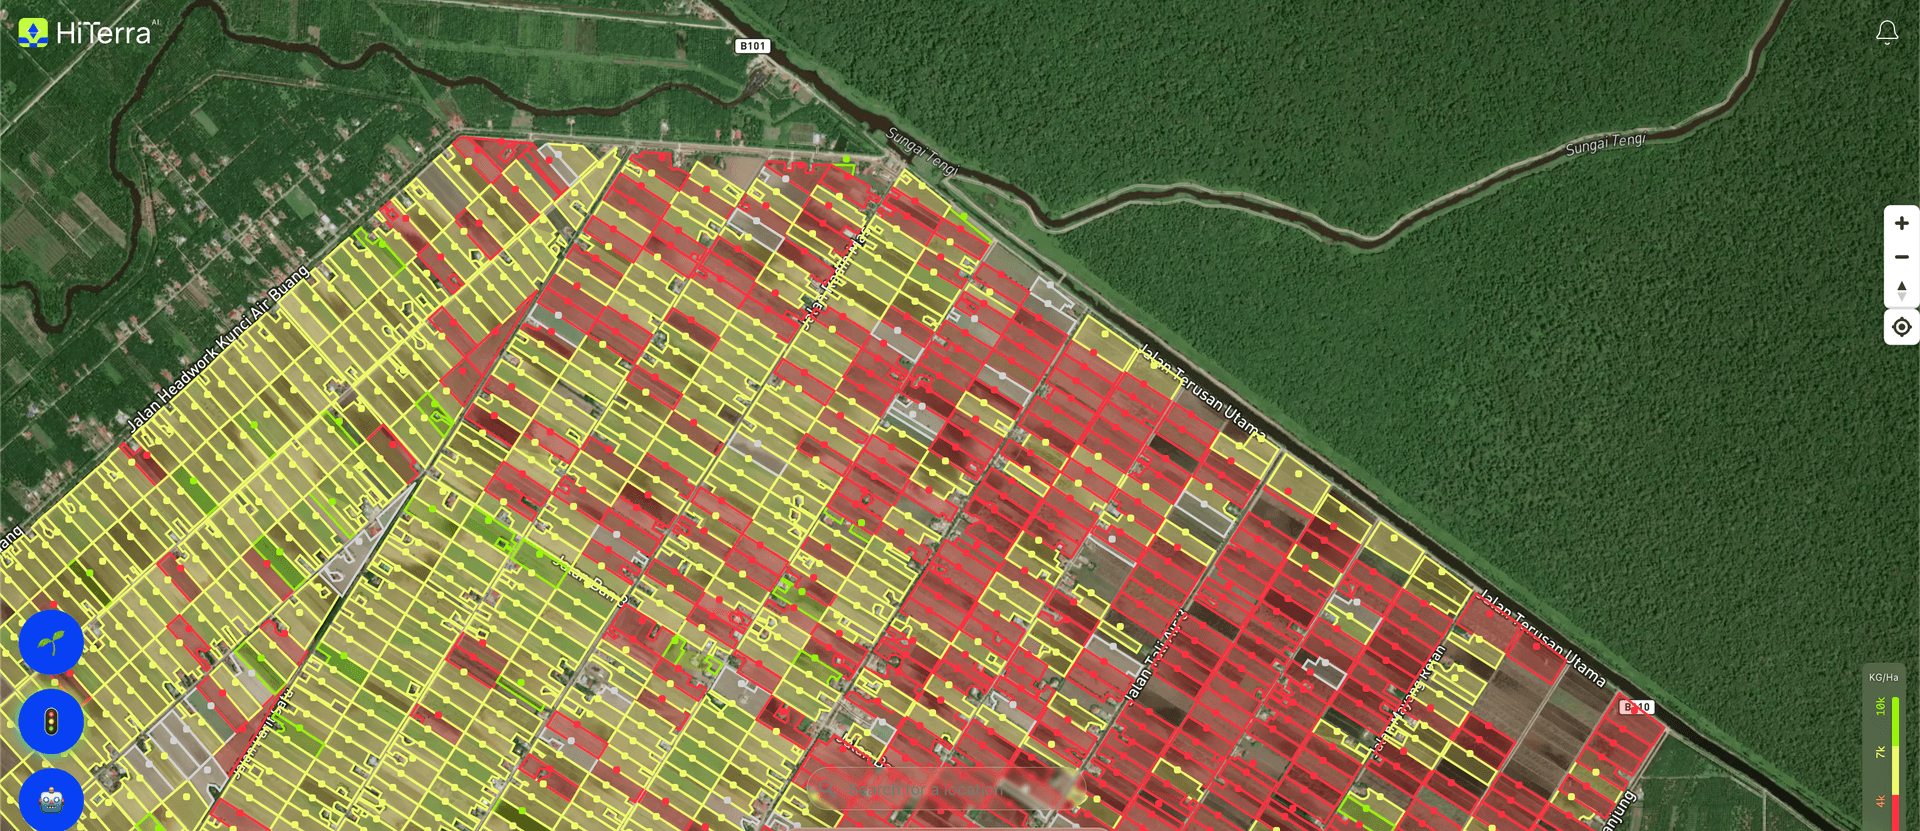
Photo: the HiTerra traffic report is showing the current fields status.
Imagine walking into your farm and seeing a map that looks like a traffic light: red, yellow, and green. On your HiTerra app, this "traffic light report" shows how your soil, crops, and management are performing at a glance. It's like a daily health check for your farm, using colors anyone can understand—even a 12-year-old. This simple system helps farmers and agri-businesses make fast decisions that boost yields, save costs, and protect the environment.
How Traffic Light Reports Help Farms
Traffic light systems are already used in farming to monitor soil and crops. For example, the Soil Health Scorecard from the UK's AHDB uses green, amber (yellow), and red to rate soil conditions, helping farmers know when to keep monitoring (green), review practices (yellow), or fix problems (red) like nutrient shortages or compaction. This idea is also used in crop control with satellite data, where parcels are colored to show growth status.
In your HiTerra app, the traffic light report turns this into a map for your farm. Each color on the map shows harvest yield amounts:
- Green areas mean high or healthy yield, telling you the soil and crops are doing great
- Yellow areas signal medium yield, hinting that something like water or fertilizer might need adjusting
- Red areas warn of low yield, showing problems that need urgent action, like poor soil health or pests
Example: How This Works in a Paddy Field (Rice) Context
In a paddy field, yield is usually measured in kg/ha (kilograms per hectare). HiTerra's traffic light report helps you quickly spot which parts of the paddy are performing well and which parts may need attention.
Yield thresholds for paddy fields:
- Red (high-risk / low yield): below 4,000 kg/ha
- Yellow (watch / medium yield): 4,000–7,000 kg/ha
- Green (healthy / high yield): 7,000 kg/ha and above
With these thresholds, you can focus field checks and actions on the red zones first (for example, drainage issues, pest pressure, nutrient stress), monitor yellow zones, and replicate good practices from green zones.
Impact on Farm Enterprises
For farm enterprises, this feature is a game-changer. It helps track soil health over time, like a health scorecard, by grading conditions based on data. Case studies show that traffic light systems help farmers improve yields, reduce fertilizer use, and prevent water waste. For example, a soil water sensor for small farmers uses similar colors to indicate water levels at different depths, guiding irrigation decisions. This means farms can grow more food while being kinder to the planet.
The traffic light report also aids management by highlighting weak spots on the map. Instead of guessing where to focus, farmers can zoom in on red zones, fix them, and watch the color change to green as yields improve. This cuts costs, increases efficiency, and supports sustainable farming goals.
Highlight: In-App Traffic Light Reporting
HiTerra's traffic light reporting feature brings this power to your fingertips. On the app, the map updates in real-time, showing three color ranges across your fields. Tap any color to see details like soil moisture, nutrient levels, or harvest forecasts. It's part of HiTerra's TerraCore AI tools, designed to make daily farming easy and data-driven.
Once you identify fields facing low harvest yield issues through the traffic light report, you can take immediate action using TerraPractice—another powerful feature in the HiTerra app. TerraPractice provides tailored farming solutions and best practices specific to your field's conditions, making it easy to apply the right interventions exactly where they're needed. No more guessing which farm practice to use—the app guides you from problem identification to solution implementation.
Give it a try on your next planting season—see how your farm's "traffic light" shifts from red to green as you grow. Perfect for students, farmers, and anyone curious about smart agriculture!